ReMind
A series of art prints that merge analytical accuracy with visual storytelling. Using global happiness data, the project reimagines statistics as abstract, nature-inspired forms that make complex information feel human, reflective, and approachable.
Role and focus
Data analysis and interpretation
Concept development
Visual storytelling and art direction
Data visualisation
Print design and production
Concept and audience
Happiness data is often consumed as charts and rankings, detached from everyday life. This project explores how analytical insight can be translated into visual forms that people want to live with. The audience includes design-conscious viewers who value meaning behind aesthetics and are drawn to work that blends intellect with emotion.
Process
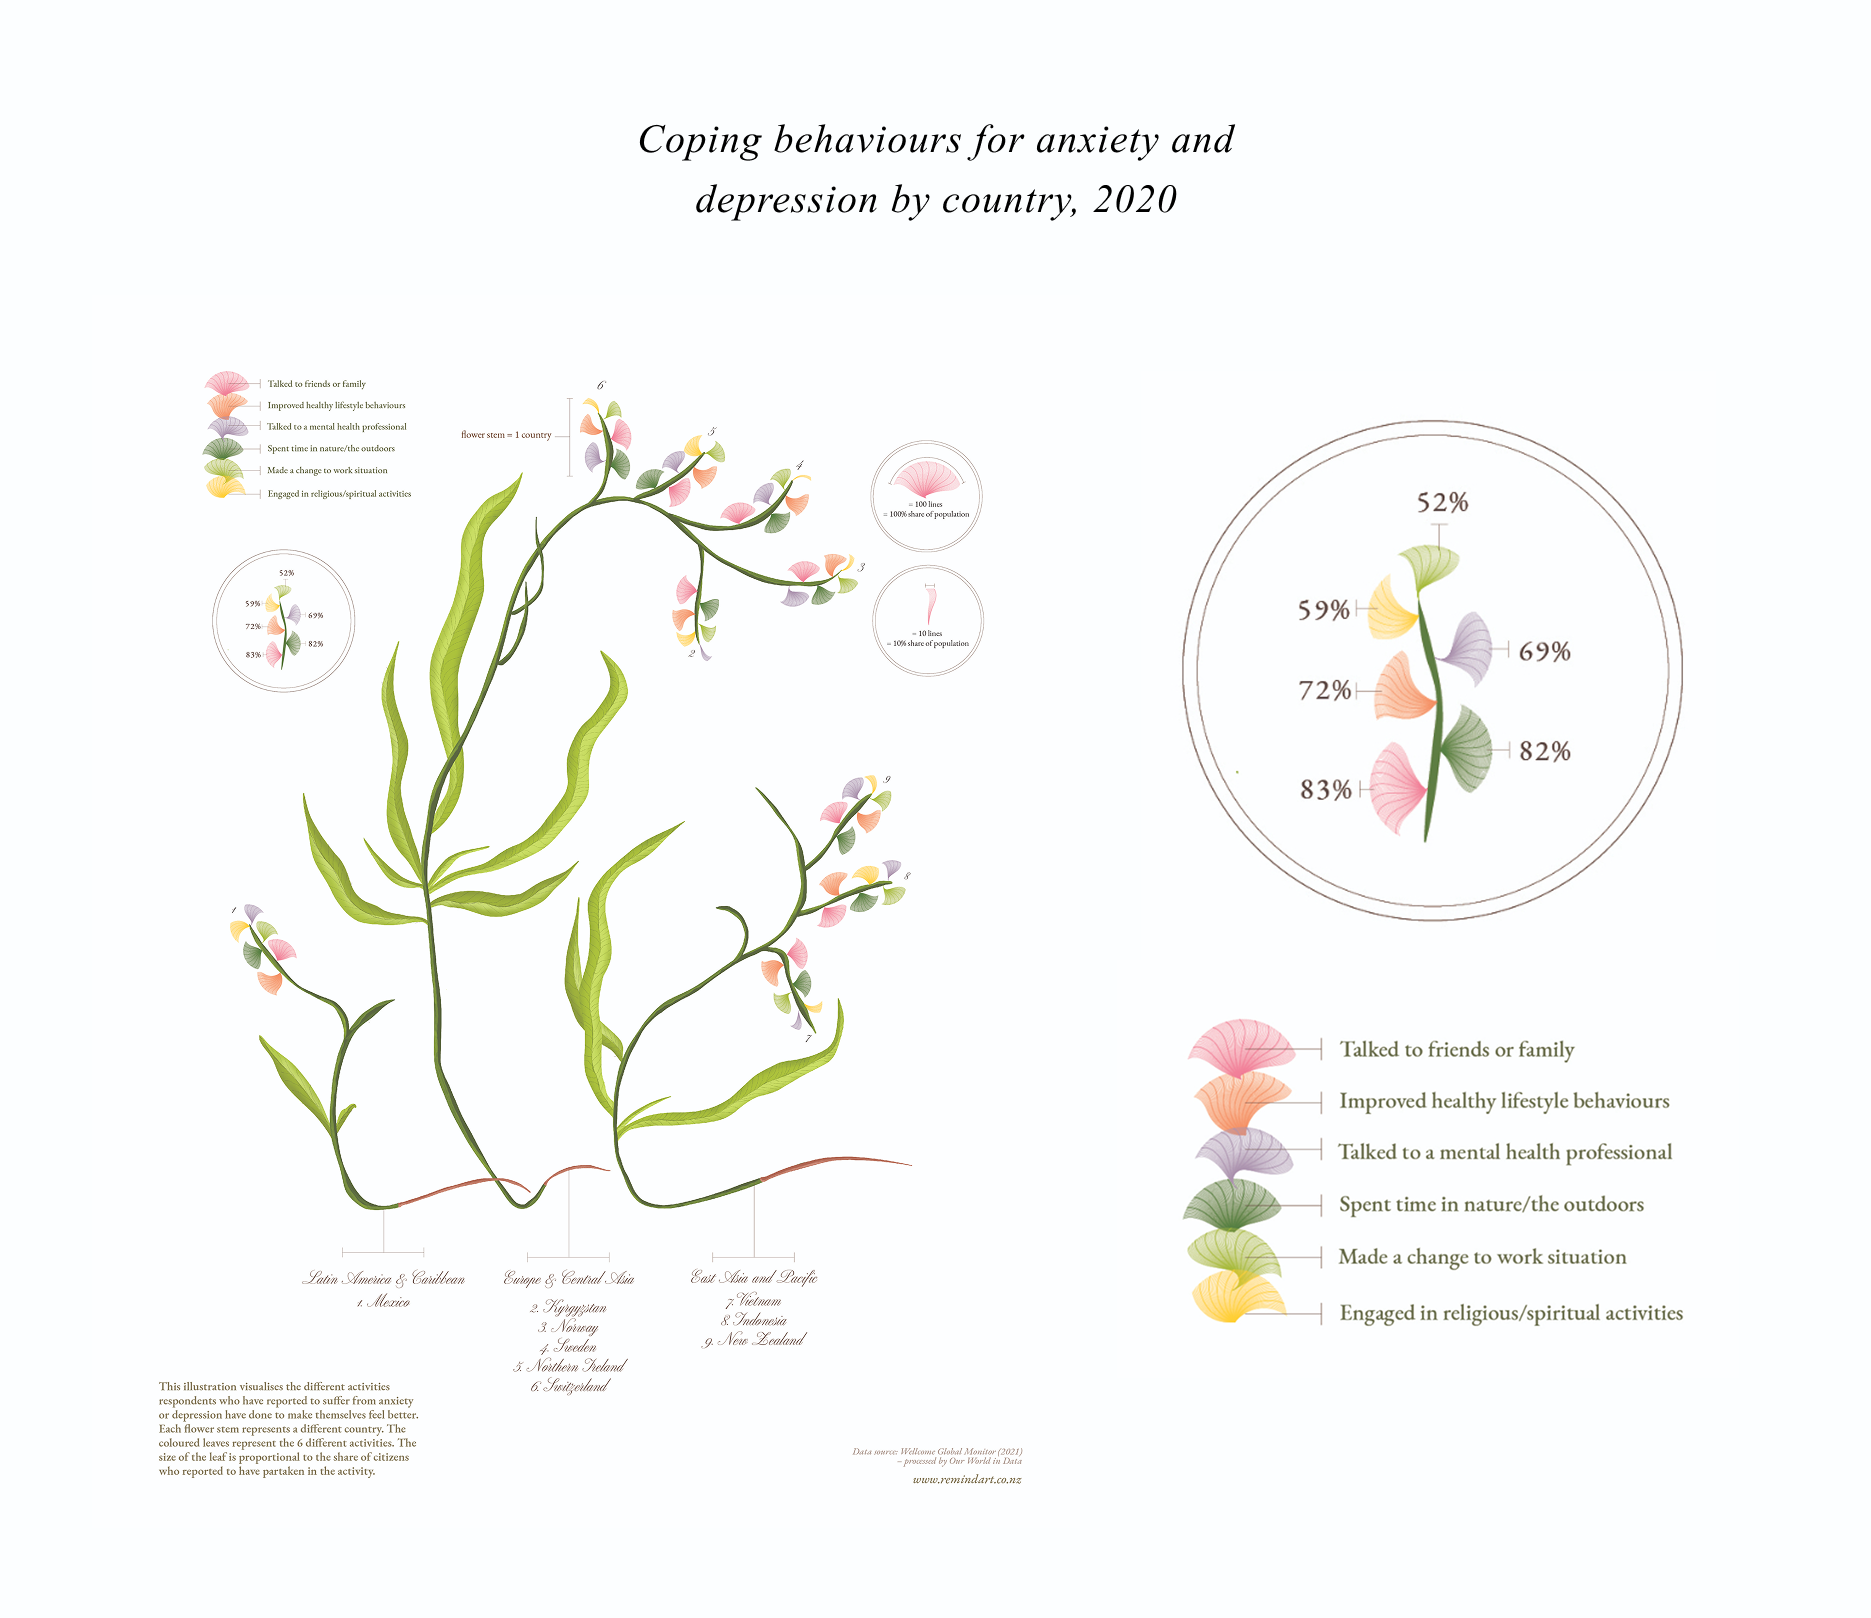
The process began with extracting and auditing large datasets to ensure accuracy and consistency. The data was structured and visualised using RAWGraphs to generate initial forms that preserved the integrity of the information.
These forms were then refined and transformed in Adobe Illustrator, where I evolved them into expressive compositions inspired by natural patterns and organic systems. Throughout the process, the goal was to maintain a clear link back to the data while allowing space for artistic interpretation.
Design principles
Data integrity before decoration.
Abstraction as a tool for accessibility.
Visual calm over analytical overload.
Outcome
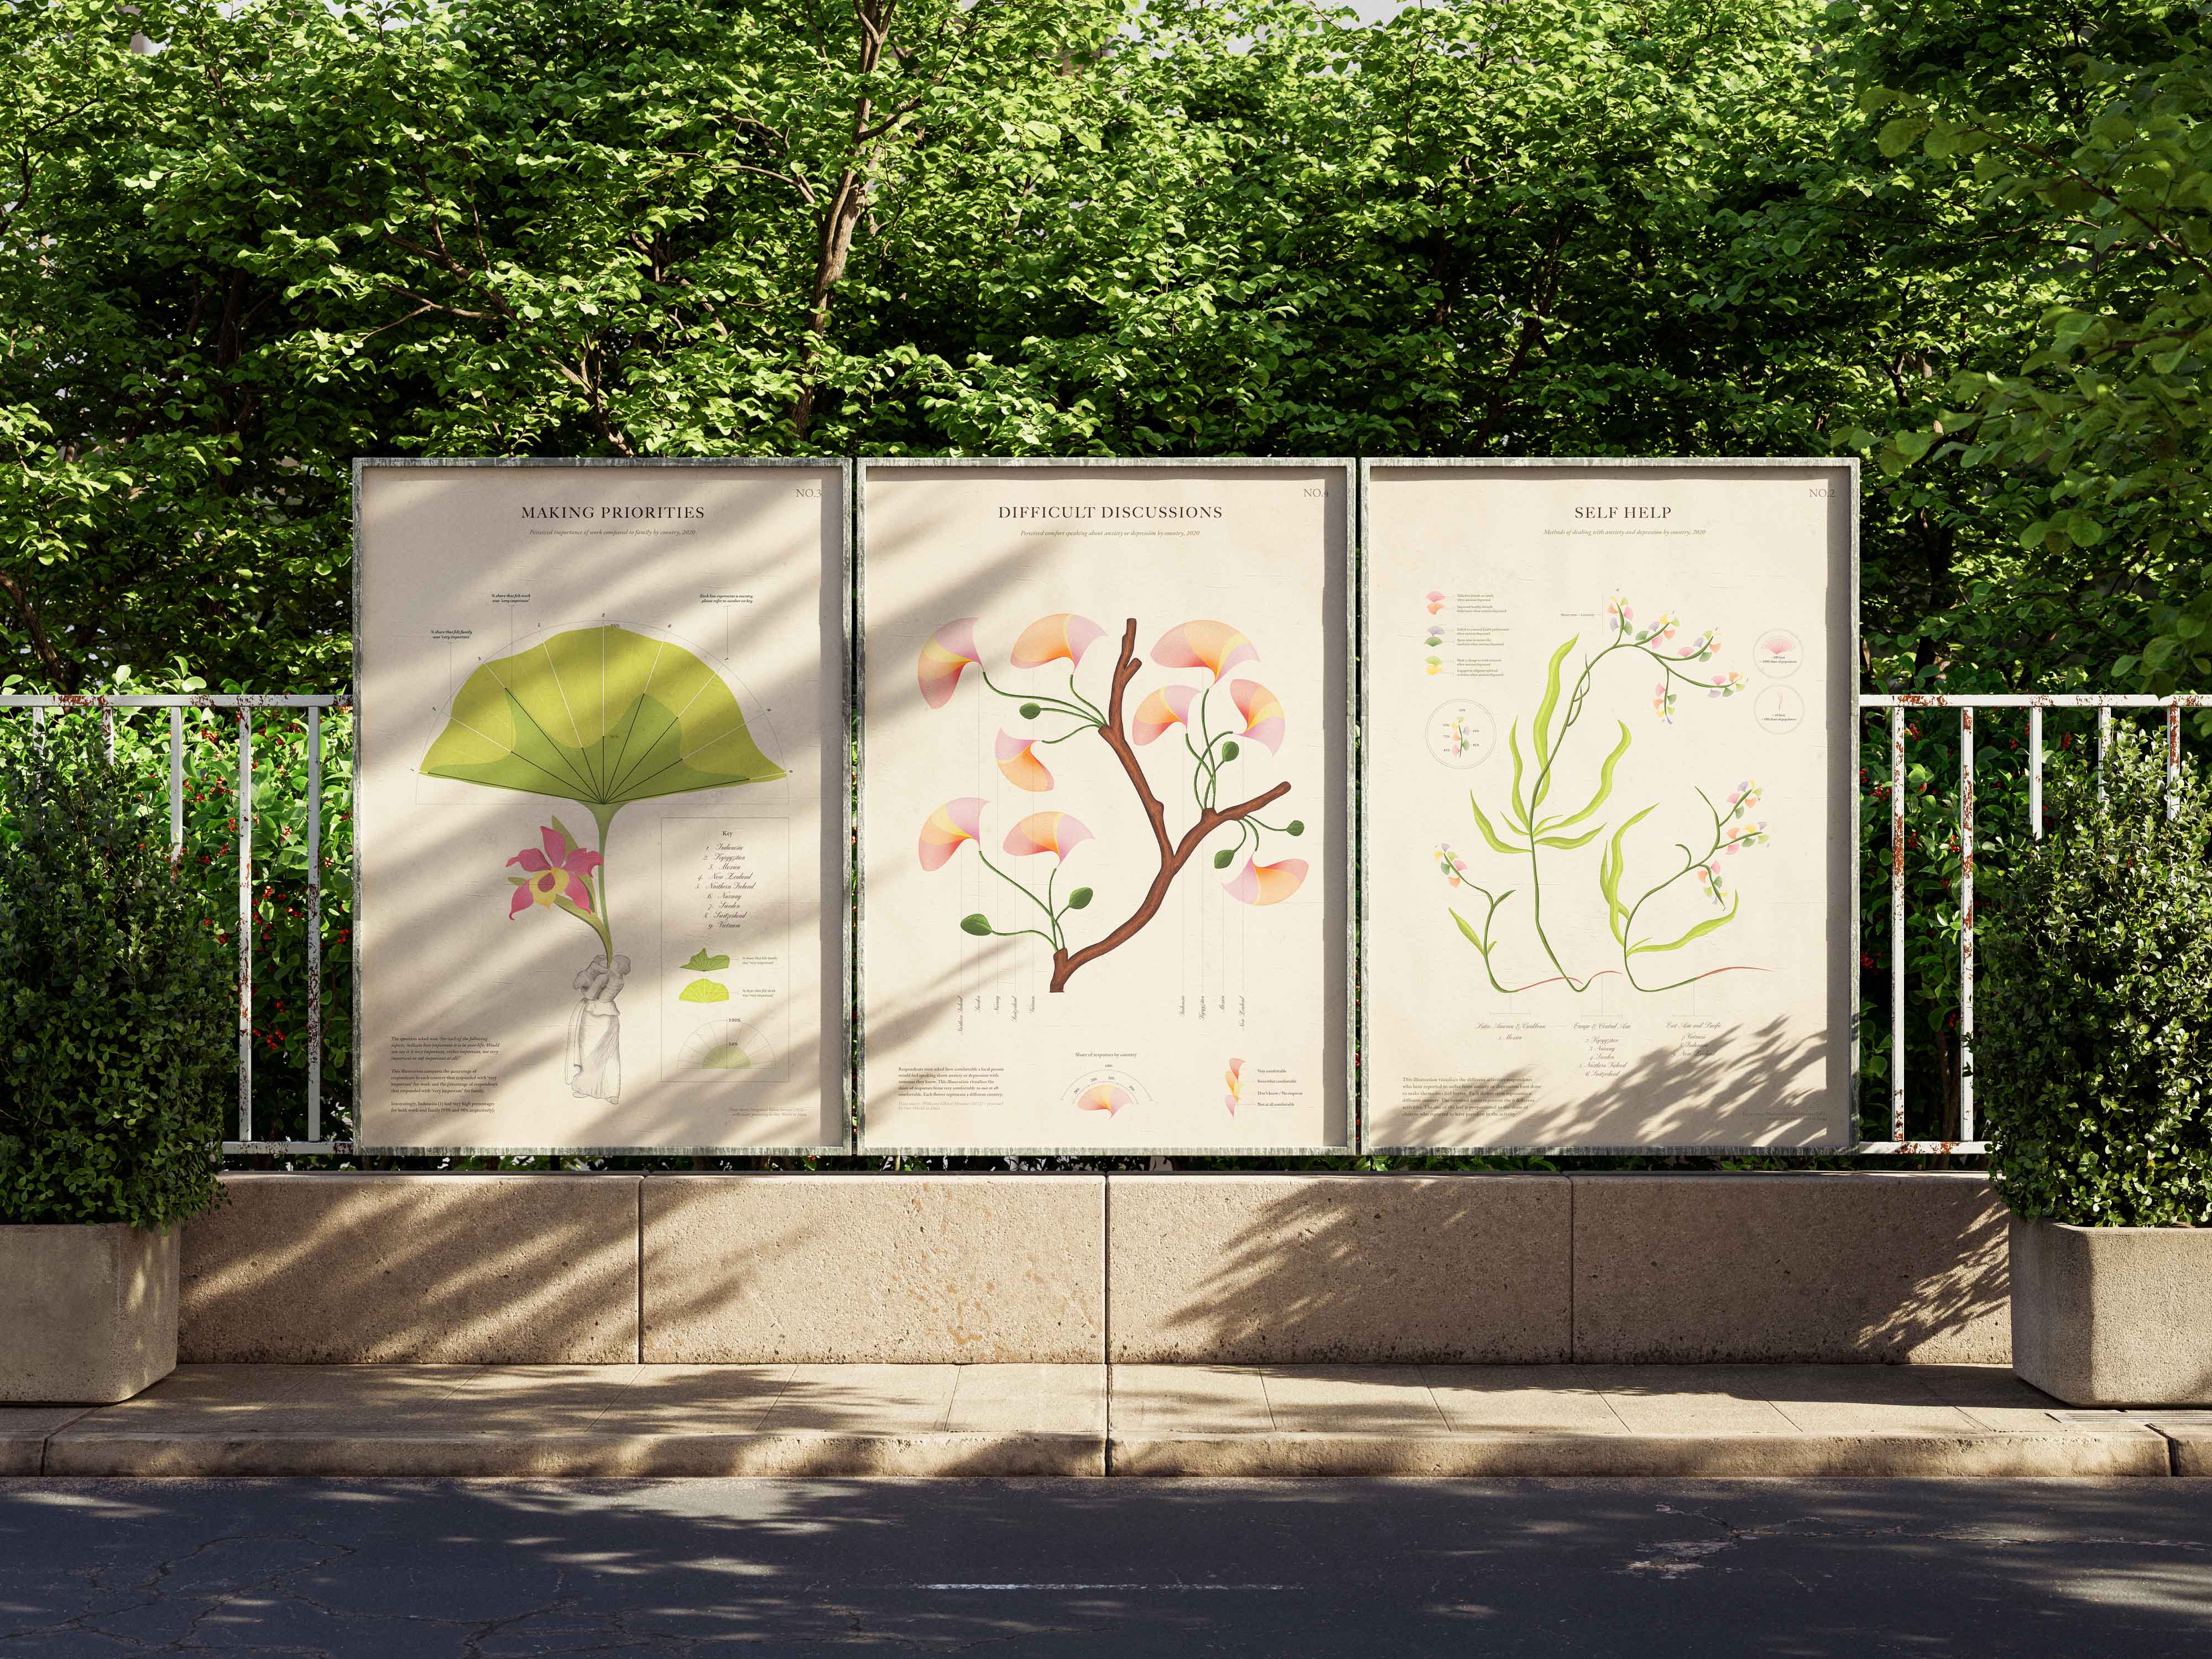
The final collection translates global happiness data into prints designed for everyday environments. Each piece offers an entry point into the underlying insight without requiring prior context, turning statistics into subtle prompts for reflection and optimism.
Services delivered
Data auditing and analysis
Concept development and art direction
Data visualisation
Illustration and print design
Tools
Excel for data extraction and auditing
RAWGraphs for structured data visualisation
Adobe Illustrator for refinement and final compositions